
How to Read Stock Indexes
what you need to know about the 3 major U.S. stock indexes,
the 10-year Treasury Note and Bitcoin to get started.

every weekday morning, before brushing their teeth, washing their faces, and textin’ back, millions of investor in the world tap in and check a few key numbers that reveal the prior day's market trends.
in each ceiy newsletter, we feature five really important indicators:
S&P 500 index (stocks)
Nasdaq index (stocks)
Dow Jones index (stocks)
10-year Treasury Note (bonds)
Bitcoin (crypto)
by diving into these, you'll grasp their significance, how they function, and why they hold importance, all easily explained without requiring advanced degrees or specialized knowledge.
before we go any further, a market index is like a report card for the stock market. it tracks the performance of a group of stocks to give you an idea of how the overall market is doing. think of it like a playlist of popular songs. instead of having to listen to every song out there to know what’s trending, you can just listen to the playlist.
green is generally good, but everything that goes up, must come down (even if just slightly).
red means people are selling and there could be a nice opportunity to buy-in at a lower price.
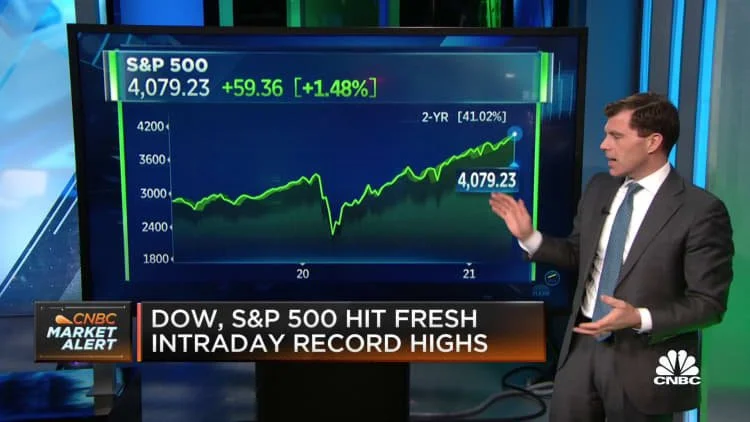
S&P 500
-
the S&P 500 is a stock market index that combines the performance of 500 of the biggest companies listed on the Nasdaq and New York Stock Exchange. to be part of this group, companies need to meet certain standards, such as having a market value of at least $8.2 billion, being based in the U.S., and showing a profit for at least the last year.
companies can be removed if they no longer meet these criteria.
-
the S&P 500 is all about the numbers. companies in the index are weighted by their market value. this means bigger companies like Microsoft and Apple have a bigger impact on the performance of the index. currently, tech companies make up more than 25% a quarter of the S&P 500's total value.
-
with 500 companies from various industries, the S&P 500 is considered one of the best indicators of how large U.S. companies are performing.
understanding the S&P 500 helps you grasp how the economy and big companies are performing. it lays the foundation for making smart financial decisions and investments in the future. plus, it can give you an edge in understanding the world around you a bit better.

NASDAQ
-
the Nasdaq Composite Index is a stock market index that tracks the performance of over 3,000 companies listed on the Nasdaq stock exchange. unlike the S&P 500, which includes companies from various sectors, the Nasdaq is known for having a high concentration of technology and internet-based companies.
-
companies in this index are also weighted by their market value. this means bigger companies like Meta and NVIDIA have a bigger impact on the performance of the index. currently, tech companies make up most of the NASDAQ's total value.
-
with its focus on technology and innovation, the Nasdaq is a great indicator of how the tech industry is doing. understanding the Nasdaq can help you see trends in technology and innovation, making it easier to make smart financial decisions and investments. plus, it can give you insights into the tech-driven world around you, which is increasingly important in today's digital age.
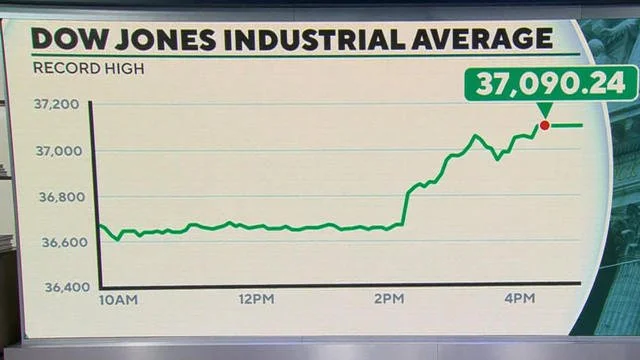
Dow Jones
-
the Dow Jones Industrial Average, often called the Dow, is a stock market index that tracks the performance of only 30 major U.S. companies. these companies are some of the largest and most well-known, like Amazon, Coca-Cola, and Verizon.
-
the Dow is weighted by the price of its stocks, meaning higher-priced stocks have more influence on the index's performance. this means that if a high-priced stock changes, it can have a big impact on the overall index. the Dow includes companies from various sectors, but only 30 of them, which makes it less diverse than indexes like the S&P.
-
the Dow is one of the oldest and most famous stock market indexes, often used as a benchmark for how the overall market is doing.
understanding the Dow can help you keep track of major companies and the general health of the economy.
10-year Treasury Note

-
the 10-year Treasury Note is a type of bond issued by the U.S. government (it's basically America taking out a loan). investors buy these notes as a safe way to invest in the government's debt and earn interest over 10 years.
-
the interest rate on the 10-year Treasury Note (aka the yield), constantly moves based on demand and how well the economy is doing. when investors buy these notes, they essentially lend money to the government, which uses the money for various projects and expenses.
the yield on the 10-year Treasury Note is also often seen as an indicator for how high or low interest rates on things like credit cards and savings account will be.
-
the 10-year Treasury Note is really important because it affects many things in the economy, like interest rates on car loans, credit cards, and savings accounts for businesses and people. understanding the movement of this indicator can help you understand why certain things cost more or less, why companies are hiring vs. now; the list goes on.
plus, it kinda gives you a bit of insight into how the government manages its debt and finances, which is important for understanding economic stability and future trends.

Bitcoin
-
Bitcoin is a type of digital currency, often referred to as cryptocurrency. it operates independently of any government or central authority, using a decentralized system called blockchain to record transactions securely and anonymously.
-
Bitcoin transactions are processed by a network of computers around the world, called miners, who verify and record transactions on the blockchain. like with stocks and bonds, you can go to an exchange to buy this type of asset.
please be aware that Bitcoin experiences a lot of volatility; which means the price can change really quickly and usually without a clear reason why. but it is the maturest of all cryptocurrencies.
-
Bitcoin is known for its potential to change how we think about money and finance. it offers fast and relatively low-cost transactions compared to traditional banking systems. understanding Bitcoin can open up opportunities for learning about technology, finance, and the future of digital payments.
what do these numbers even mean??
remember when we said major indexes are like report cards? well, the numbers you see next to them are their grades. they tell you how well an index has been doing, or not doing, for the past week, month, year, etc. and you use that information to inform your decisions (e.g. do I save or do I invest?).
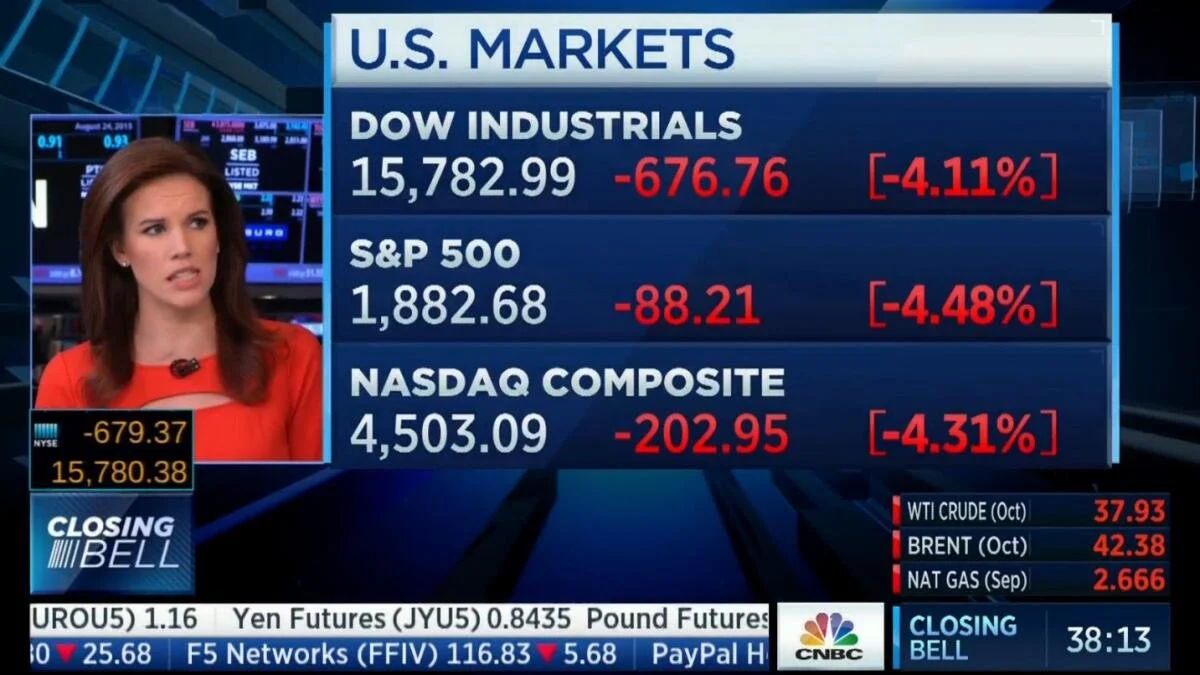
prices decreasing (red) isn’t always a bad thing. well-informed, responsible investors may see it as an opportunity to buy low now and sell high later.
-
this column shows the current value of the market index. think of it as the grade of the stock market. it tells you how much all the stocks in that index are worth together at the moment.
example: if the S&P 500 index price is 4,500, it means the combined value of the 500 biggest companies' stocks in the index equals 4,500.
-
this column shows how much the index’s value has changed in dollars over the week, month, or year. it tells you whether the market has gone up or down since the start of the week.
example: if the S&P 500 started the week at 4,400 and is now at 4,500, the dollar difference is +100. this means the index has increased by 100 points over the week.
-
this column shows the percentage change in the index’s value over the week. it tells you how big the change as a percent.
example: if the S&P 500 started the week at 4,400 and is now at 4,500, the percent difference is 2.27%. this means the index has gone up by 2.27% this week.
fun fact: well-informed, responsible investors always think about their investments in percentage terms. it's how they determine if an investment is worth the risk.